Logging Web service and Browser exceptions
There's a HTTP module that tracks exceptions in Web service (Web application) . The log is saved as a series of XML files in the App_Data folder of the Web application (typically C:\tera\GN4\Web\GNPortal\App_Data)
The folder contains all exceptions generated by the server for any client: Browser, Ted, Fred.
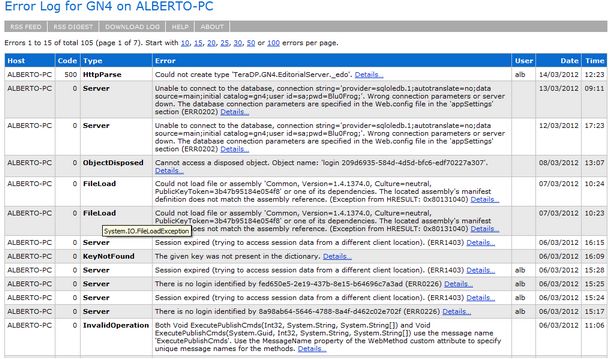
There's a Web interface to review exceptions (example: http://localhost/gn4/elmah.axd):
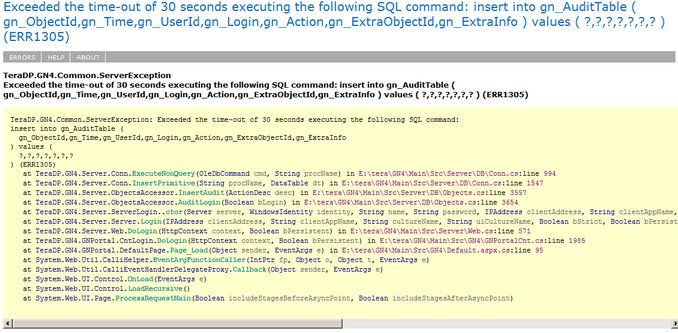
For every exception you can review the host, the exception type, the HTTP response code, the user, date and time, and all details such as stack trace and server variables:
By default, you can review the exceptions only on the Web application host (server). If you want to change such behavior, change path where the exceptions are saved in the Web.config file:
<elmah>
<security allowRemoteAccess="0" />
<errorLog type="Elmah.XmlFileErrorLog, Elmah" logPath="~/App_Data" />
</elmah>
The list of exceptions is available also in the RSS format (http://localhost/gn4/elmah.axd/rss ) or you can download it as a .CSV file.
By adding the following parameter to the <elmah> section:
connectionStringName="..." />
...you can specify a SQL provider and write exceptions in a database. If you are interested to this possibility look at the script to create the tables/stored procedure. There are many provider available for Oracle, MySQL, and implementation is described here: http://code.google.com/p/elmah/wiki/ErrorLogImplementations
/* ------------------------------------------------------------------------ TABLES ------------------------------------------------------------------------ */
CREATE TABLE [dbo].[ELMAH_Error] ( [ErrorId] UNIQUEIDENTIFIER NOT NULL, [Application] NVARCHAR(60) COLLATE SQL_Latin1_General_CP1_CI_AS NOT NULL, [Host] NVARCHAR(50) COLLATE SQL_Latin1_General_CP1_CI_AS NOT NULL, [Type] NVARCHAR(100) COLLATE SQL_Latin1_General_CP1_CI_AS NOT NULL, [Source] NVARCHAR(60) COLLATE SQL_Latin1_General_CP1_CI_AS NOT NULL, [Message] NVARCHAR(500) COLLATE SQL_Latin1_General_CP1_CI_AS NOT NULL, [User] NVARCHAR(50) COLLATE SQL_Latin1_General_CP1_CI_AS NOT NULL, [StatusCode] INT NOT NULL, [TimeUtc] DATETIME NOT NULL, [Sequence] INT IDENTITY (1, 1) NOT NULL, [AllXml] NTEXT COLLATE SQL_Latin1_General_CP1_CI_AS NOT NULL ) ON [PRIMARY] TEXTIMAGE_ON [PRIMARY]
GO
ALTER TABLE [dbo].[ELMAH_Error] WITH NOCHECK ADD CONSTRAINT [PK_ELMAH_Error] PRIMARY KEY NONCLUSTERED ([ErrorId]) ON [PRIMARY] GO
ALTER TABLE [dbo].[ELMAH_Error] ADD CONSTRAINT [DF_ELMAH_Error_ErrorId] DEFAULT (NEWID()) FOR [ErrorId] GO
CREATE NONCLUSTERED INDEX [IX_ELMAH_Error_App_Time_Seq] ON [dbo].[ELMAH_Error] ( [Application] ASC, [TimeUtc] DESC, [Sequence] DESC ) ON [PRIMARY] GO
/* ------------------------------------------------------------------------ STORED PROCEDURES ------------------------------------------------------------------------ */
SET QUOTED_IDENTIFIER ON GO SET ANSI_NULLS ON GO
CREATE PROCEDURE [dbo].[ELMAH_GetErrorXml] ( @Application NVARCHAR(60), @ErrorId UNIQUEIDENTIFIER ) AS
SET NOCOUNT ON
SELECT [AllXml] FROM [ELMAH_Error] WHERE [ErrorId] = @ErrorId AND [Application] = @Application
GO SET QUOTED_IDENTIFIER OFF GO SET ANSI_NULLS ON GO
SET QUOTED_IDENTIFIER ON GO SET ANSI_NULLS ON GO
CREATE PROCEDURE [dbo].[ELMAH_GetErrorsXml] ( @Application NVARCHAR(60), @PageIndex INT = 0, @PageSize INT = 15, @TotalCount INT OUTPUT ) AS
SET NOCOUNT ON
DECLARE @FirstTimeUTC DATETIME DECLARE @FirstSequence INT DECLARE @StartRow INT DECLARE @StartRowIndex INT
SELECT @TotalCount = COUNT(1) FROM [ELMAH_Error] WHERE [Application] = @Application
-- Get the ID of the first error for the requested page
SET @StartRowIndex = @PageIndex * @PageSize + 1
IF @StartRowIndex <= @TotalCount BEGIN
SET ROWCOUNT @StartRowIndex
SELECT @FirstTimeUTC = [TimeUtc], @FirstSequence = [Sequence] FROM [ELMAH_Error] WHERE [Application] = @Application ORDER BY [TimeUtc] DESC, [Sequence] DESC
END ELSE BEGIN
SET @PageSize = 0
END
-- Now set the row count to the requested page size and get -- all records below it for the pertaining application.
SET ROWCOUNT @PageSize
SELECT errorId = [ErrorId], application = [Application], host = [Host], type = [Type], source = [Source], message = [Message], [user] = [User], statusCode = [StatusCode], time = CONVERT(VARCHAR(50), [TimeUtc], 126) + 'Z' FROM [ELMAH_Error] error WHERE [Application] = @Application AND [TimeUtc] <= @FirstTimeUTC AND [Sequence] <= @FirstSequence ORDER BY [TimeUtc] DESC, [Sequence] DESC FOR XML AUTO
GO SET QUOTED_IDENTIFIER OFF GO SET ANSI_NULLS ON GO
SET QUOTED_IDENTIFIER ON GO SET ANSI_NULLS ON GO
CREATE PROCEDURE [dbo].[ELMAH_LogError] ( @ErrorId UNIQUEIDENTIFIER, @Application NVARCHAR(60), @Host NVARCHAR(30), @Type NVARCHAR(100), @Source NVARCHAR(60), @Message NVARCHAR(500), @User NVARCHAR(50), @AllXml NTEXT, @StatusCode INT, @TimeUtc DATETIME ) AS
SET NOCOUNT ON
INSERT INTO [ELMAH_Error] ( [ErrorId], [Application], [Host], [Type], [Source], [Message], [User], [AllXml], [StatusCode], [TimeUtc] ) VALUES ( @ErrorId, @Application, @Host, @Type, @Source, @Message, @User, @AllXml, @StatusCode, @TimeUtc )
GO SET QUOTED_IDENTIFIER OFF GO SET ANSI_NULLS ON GO
|


